Transdermal Delivery - CD Formulation
Call Us:
- Home
- Services
- Transdermal Formulation Development
- Gel Transdermal Formulation Development
- Cream Transdermal Formulation Development
- Ointment Transdermal Formulation Development
- Spray Transdermal Formulation Development
- Transdermal Patch Development
- Single-Layer Drug-In-Adhesive Transdermal Patch Development
- Multi-Layer Drug-In-Adhesive Transdermal Patch Development
- Matrix Transdermal Patch Development
- Reservoir Transdermal Patch Development
- Vapor Transdermal Patch Development
- Active Gel Transdermal Patch Development
- Controlled Release Transdermal Patch Development
- Transdermal Microneedle Patch Development
- Nano Transdermal Patch Development
- Nanofiber/Microfiber Transdermal Patch Development
- Microemulsion/Nanoemulsion Transdermal Patch Development
- Metal Nano Transdermal Patch Development
- Solid Lipid Nano Transdermal Patch Development
- Polymer Nano Transdermal Patch Development
- Vesicle Nano Transdermal Patch Development
- Nano Gel Transdermal Patch Development
- Liposome Transdermal Patch Development
- Nanocrystal Transdermal Patch Development
- Ethosomes Transdermal Patch Development
- Peptide Transdermal Formulation Development
- Protein Transdermal Formulation Development
- Nucleic Acid Transdermal Formulation Development
- Transdermal Formulation Analysis and Testing Services
- Conventional Characterization for Transdermal Formulation
- Transdermal Formulation Appearance Analysis
- Transdermal Formulation Rheological Properties Analysis
- Transdermal Formulation Weight Testing
- Transdermal Formulation Thickness Testing
- Transdermal Formulation Folding Endurance Testing
- Transdermal Formulation Moisture Absorption Rate Testing
- Transdermal Formulation Moisture Content Percentage Testing
- Transdermal Formulation Surface pH Testing
- Transdermal Formulation Swelling Index Testing
- Transdermal Formulation Tensile Strength Testing
- Transdermal Formulation Drug Content and Excipient Content Assays
- Transdermal Formulation Drug Content Uniformity Testing
- Transdermal Formulation Crystal Structure Analysis
- Transdermal Formulation Peel Adhesion Testing
- Transdermal Formulation Shear Testing
- Transdermal Formulation Release Liner Removal Testing
- Transdermal Formulation Tack Testing
- Transdermal Formulation Cold Flow Evaluation
- Transdermal Formulation Residual Drug Analysis
- In Vitro Penetration Testing of Transdermal Formulation
- In Vitro Release Testing of Transdermal Formulation
- Nanoproperty Characterization for Transdermal Formulation
- Quality Control and Release Testing for Transdermal Formulation
- Transdermal Formulation API and Excipient Characterization
- Transdermal Formulation Analytical Method Development and Validation
- Transdermal Formulation Analytical Method Transfer
- Transdermal Formulation Batch Release Testing
- Transdermal Formulation Residual Solvents Testing
- Transdermal Formulation Extractables and Leachables Testing
- Transdermal Formulation Elemental Impurities Testing
- Transdermal Formulation Impurity Analysis
- Transdermal Formulation Stability Testing
- Transdermal Formulation Temperature Cycling Testing
- Transdermal Formulation Forced Degradation Testing
- Transdermal Formulation Packaging Integrity Testing
- Transdermal Formulation Bioequivalence Evaluation
- Conventional Characterization for Transdermal Formulation
- Biological Evaluation for Transdermal Formulation
- GMP Manufacturing Services of Transdermal Formulation
- Transdermal Formulation Development
- Technologies
- Applications
- Order Online
- Company
- Inquiry
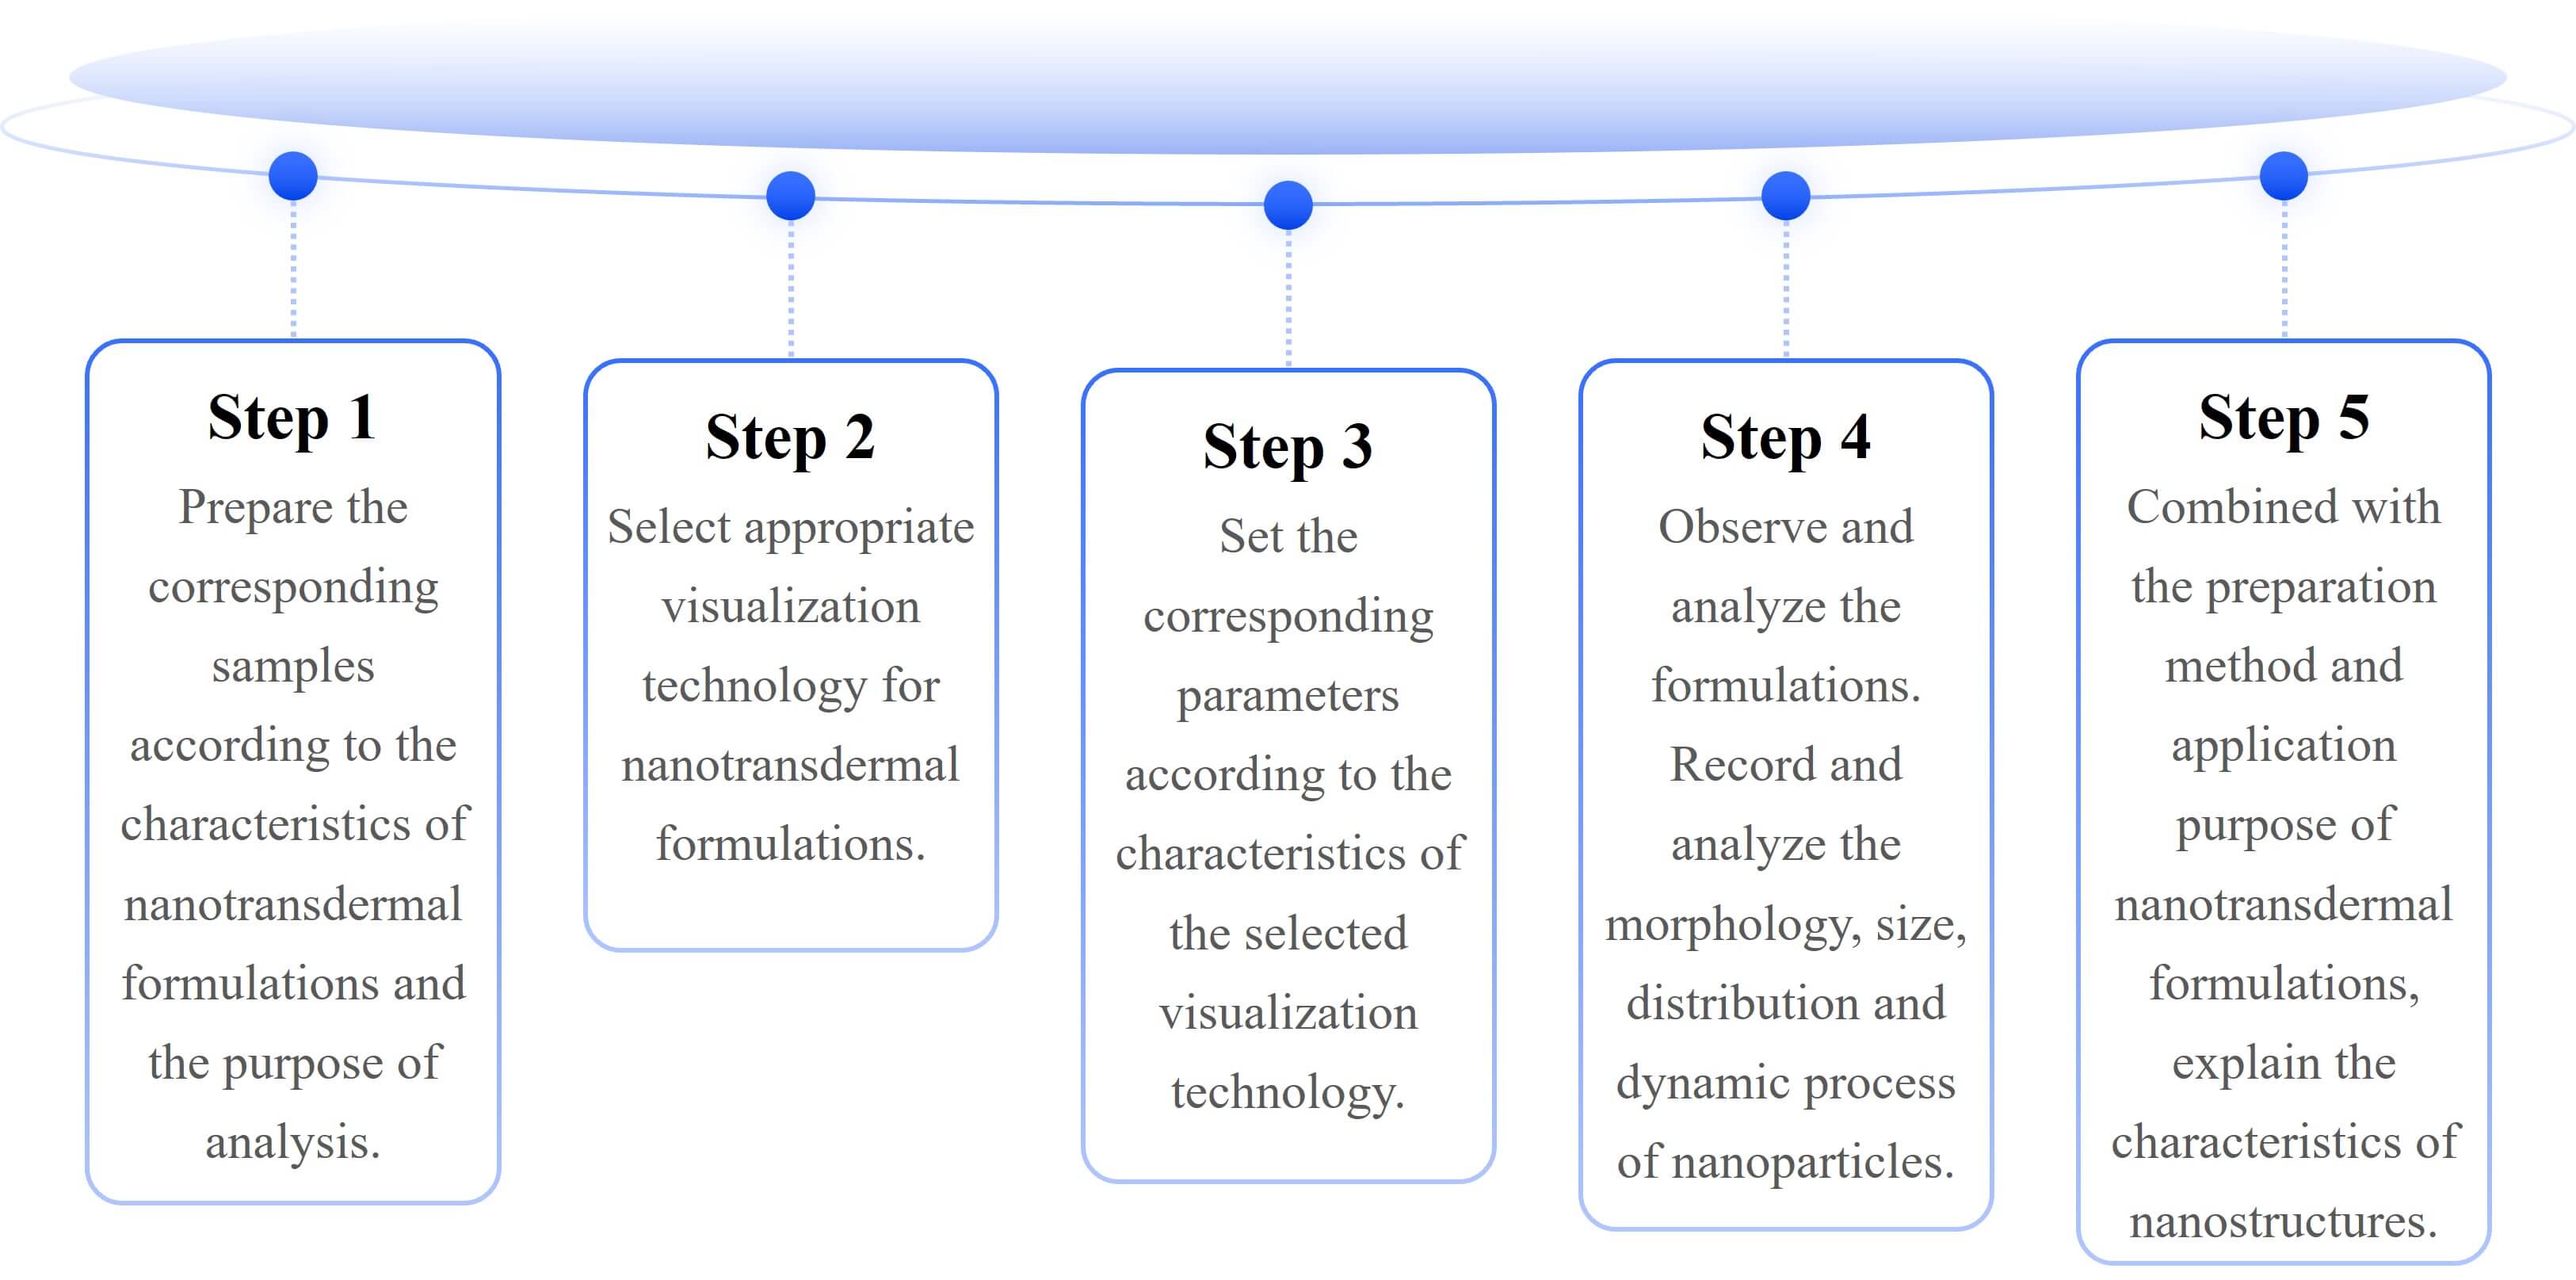 Fig.1 Flow chart of nanostructures visualization analysis of nano transdermal formulations. (CD Formulation)
 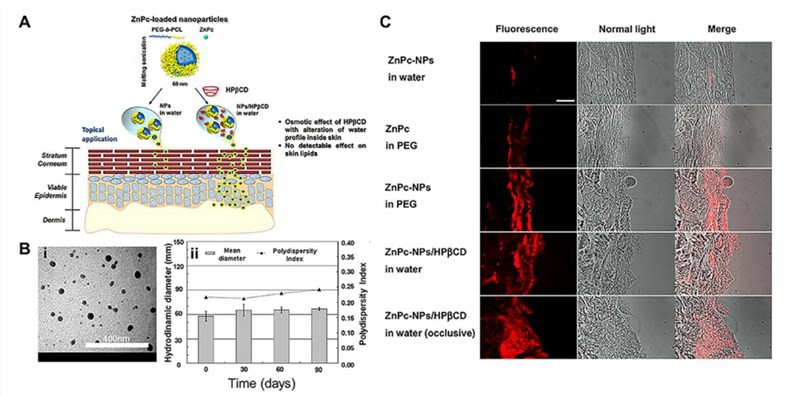 Fig.2 Preparation and evaluation of polymer NPs through the skin. (A) Poly (ethylene glycol)-poly (3-caprolactone)-amphiphilic diblock copolymer (PEG-b-PCL) NPs coupled with (2-hydroxypropyl)-b-cyclodextrin (HPbCD) NPs as a novel vehicle for the transdermal delivery of highly lipophilic compounds. (B) The evaluation and characterization of NPs. (i) TEM image of ZnPc-NPs (0.2% theoretical loading) and (ii) colloidal properties of freeze dried ZnPc-NPs/HPbCD stored in the dark at 4 °C after dispersion in water. (C) Fluorescence images of ski sections after 24 h of permeation experiment. ZnPc red fluorescence can be observed. Merged pictures were obtained by superimposing brightfield and fluorescence images of the same area. Scale bar: 500 mm. (Lijun Liu, et al. 2023)