Therapeutic Proteins & Peptides - CD Formulation
Call Us:
- Home
- Services
- Therapeutic Peptide Synthesis and Production
- Therapeutic Peptide Chemical Synthesis
- Therapeutic Peptide Biosynthesis
- Custom Specialty Peptides Synthesis
- Multiple Antigenic Peptide (MAP) Synthesis
- Cyclic Peptide Synthesis
- Stapled Peptide Synthesis
- Long Peptide Synthesis
- Cell Penetrating Peptide (CPP) Synthesis
- Linear Peptide Synthesis
- Peptoid Synthesis
- Disulfide-Rich Peptide (DSR) Synthesis
- Peptide Antigens Synthesis
- D-Amino Acid-Containing Peptide Synthesis
- Bicyclic Peptide Synthesis
- Custom Modified Peptide Synthesis
- C-Terminal Modified Peptide Synthesis
- N-Terminal Modified Peptide Synthesis
- Unusual & Non-natural Amino Acids Modified Peptide Synthesis
- Phosphorylated Peptide Synthesis
- Prenylated Peptide Synthesis
- Sulphated Peptide Synthesis
- PEGylated Peptide Synthesis
- Biotinylated Peptide Synthesis
- Glycosylated Peptide Synthesis
- Acetylated Peptide Synthesis
- Amidated Peptide Synthesis
- Methylated Peptide Synthesis
- Peptide Dimer Synthesis
- Fatty Acid Modified Peptide Synthesis
- Custom Labeled & Conjugated Peptide Synthesis
- Enzyme Labeled Peptide Synthesis
- Isotope Labeled Peptide Synthesis
- Imaging Agent Labeled Peptide Synthesis
- Quenched Fluorescent Peptide (FRET Peptide) Synthesis
- Fluorescence Labeled Peptide Synthesis
- Carrier Protein-Conjugated Peptide Synthesis
- DNA-Conjugated Peptide Synthesis
- RNA-Conjugated Peptide Synthesis
- siRNA-Conjugated Peptide Synthesis
- Nanoparticle-Conjugated Peptide Synthesis
- Gold Nanoparticle-Conjugated Peptide Synthesis
- Therapeutic Peptide Library
- Therapeutic Peptide Array
- Large Scale Therapeutic Peptide Synthesis
- Neoantigen Peptide Service
- Therapeutic Protein Production & Engineering
- Therapeutic Protein Production
- Yeast Expression System-Based Therapeutic Protein Production
- Baculovirus-Insect Cell Expression System-Based Therapeutic Protein Production
- Escherichia Coli Expression System-Based Therapeutic Protein Production
- Mammalian Cell Expression System-Based Therapeutic Protein Production
- Glyco-Engineering-Based Therapeutic Protein Production
- Eukaryotic Algae Engineering-Based Therapeutic Protein Production
- Therapeutic Protein Engineering
- Therapeutic Protein Production
- Therapeutic Proteins & Peptides Process Development
- Cell Line Development for Therapeutic Proteins & Peptides
- Therapeutic Proteins & Peptides Upstream Cell Culture Process Development
- Therapeutic Proteins & Peptides Upstream Fermentation Process Development
- Therapeutic Peptides Upstream Synthetic Process Development
- Therapeutic Proteins Downstream Purification Process Development
- Therapeutic Peptides Downstream Purification & Isolation Process Development
- Therapeutic Proteins & Peptides Formulation Process Development
- Therapeutic Proteins & Peptides Process Characterization and Process Validation
- Therapeutic Proteins & Peptides Production Process Scale-up
- Therapeutic Proteins & Peptides Technology Transfer
- Proteins & Peptides Formulation Research and Development
- Proteins & Peptides Pre-formulation Studies
- Proteins & Peptides Formulation Development
- Proteins & Peptides Liquid Formulation Development
- Proteins & Peptides Sterile Formulation Development
- Proteins & Peptides Buffer-free Lyophilized Formulation Development
- Proteins & Peptides High-concentration Formulation Development
- Protein & Peptide Lyophilization Formulation Development
- Proteins & Peptides Spray Drying Formulation Development
- Proteins & Peptides Drug Delivery System Development
- Proteins & Peptides Oral Delivery System Development
- Proteins & Peptides Transdermal Delivery System Development
- Proteins & Peptides Injectable Delivery System Development
- Proteins & Peptides Inhaled Delivery System Development
- Proteins & Peptides Intranasal Delivery System Development
- Proteins & Peptides Innovative Delivery System Delivery Development
- Proteins & Peptides Liposomal Delivery System Development
- Proteins & Peptides Microneedle Delivery System Development
- Proteins & Peptides Microspheres Delivery System Development
- Proteins & Peptides Nanoparticles Delivery System Development
- Proteins & Peptides Microemulsion Delivery System Development
- Proteins & Peptides Hydrogels Delivery System Development
- Packaging Material Screening and Testing Services for Protein & Peptide Formulation
- Proteins & Peptides Characterization and Analytical Testing Services
- Therapeutic Proteins & Peptides Characterization
- Proteins & Peptides Primary Structure Characterization
- Higher-Order Structures (HOS) Proteins & Peptides Characterization
- Peptide Mapping Analysis
- Proteins & Peptides Particle and Aggregation Characterization
- Proteins & Peptides Viscosity Analysis
- Proteins & Peptides Quantitative Analysis
- Proteins & Peptides Sequencing Analysis
- Amino Acid Analysis
- Post-translational Modifications (PTMs) Analysis
- Proteins & Peptides Stability and Thermal Denaturation Analysis
- Proteins & Peptides Crystal Structure Elucidation
- Proteins & Peptides Druggability Assessment
- Proteins & Peptides Formulation Analysis
- Proteins & Peptides Quality Control and Release Testing
- Proteins & Peptides Analytical Method Development
- Proteins & Peptides Analytical Method Validation and Transfer
- Proteins & Peptides Product-related Impurity Analysis
- Proteins & Peptides Process-related Impurity Analysis
- Proteins & Peptides Elemental-related Impurity Analysis
- Proteins & Peptides Residual Solvent and Volatile Impurity Analysis
- Proteins & Peptides Extractables and Leachables Analysis
- Proteins & Peptides Residual Host Cell DNA Testing
- Proteins & Peptides Residual Host Cell Protein (HCP) Analysis
- Virus Clearance Testing
- Cell Line Characterization
- Proteins & Peptides Biosimilarity Studies
- Proteins & Peptides Comparability Studies
- Proteins & Peptides Stability Testing
- Proteins & Peptides Forced Degradation Studies
- Proteins & Peptides Batch-release Testing
- Proteins & Peptides Biological Evaluation
- Therapeutic Proteins & Peptides Characterization
- Proteins & Peptides cGMP Manufacturing
- Therapeutic Peptide Synthesis and Production
- Technologies
- Prtoein & Peptide Characterization Technologies
- Dynamic Light Scattering (DLS) Technology
- Differential Scanning Fluorescence (DSF) Technology
- Analytical Ultracentrifugation (AUC) Technology
- Differential Scanning Calorimetry (DSC) Technology
- Asymmetrical Flow Field-Flow Fractionation (AF4) Technology
- Hollow Fiber Flow-Field-Flow Fractionation (HF5) Technology
- Nanoparticle Tracking Analysis (NTA) Technology
- Micro-Flow Imaging (MFI) Technology
- Multi-angle Light Scattering (MALS) Technology
- Multi-angle Dynamic Light Scattering (MADLS) Technology
- X-ray Diffraction (XRD) Technology
- UV-Vis Spectrophotometry Technology
- Circular Dichroism (CD) Spectroscopy Technology
- Fourier Transform Infrared (FT-IR) Spectroscopy Technology
- Cryo-electron Microscopy (cryo-EM) Technology
- Small-angle X-ray Scattering (SAXS) Technology
- Mass Spectrometry (MS)-Based Sequencing Technology
- Hydrogen-Deuterium Exchange Mass Spectrometry (HDX-MS) Technology
- Isoelectric Focusing (IEF) Technology
- Capillary Isoelectric Focusing (cIEF) Technology
- Capillary Zone Electrophoresis-Mass Spectrometry (CZE-MS) Technology
- SDS-PAGE Technology
- Capillary Gel Electrophoresis (CGE) Technology
- Surface Plasmon Resonance (SPR) Technology
- Viral Titers Determination Using TCID50
- Liquid Chromatography (LC) Technologies
- Ion Exchange Chromatography (IEX) Technology
- Hydrophobic Interaction Chromatography (HIC) Technology
- Size Exclusion Chromatography (SEC) Technology
- Affinity Chromatography (AC) Technology
- Reversed-phase Chromatography (RP-HPLC / RP-UPLC) Technology
- Mixed Mode Chromatography (MMC) Technology
- Fast Protein Liquid Chromatography (FPLC) Technology
- Tangential Flow Filtration (TFF) Technology
- Membrane Filtration Technology
- Protein Expression Technologies
- Peptide Synthesis Technologies
- Prtoein & Peptide Characterization Technologies
- Online Order
- Company
- Inquiry
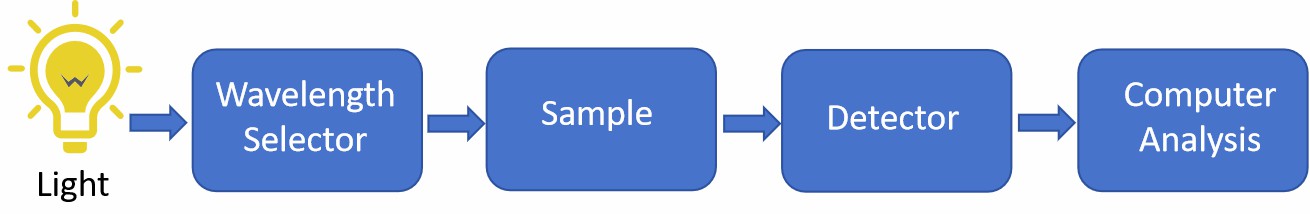 Fig. 1 A simplified schematic of a UV-Vis spectrophotometer. (CD Formulation)
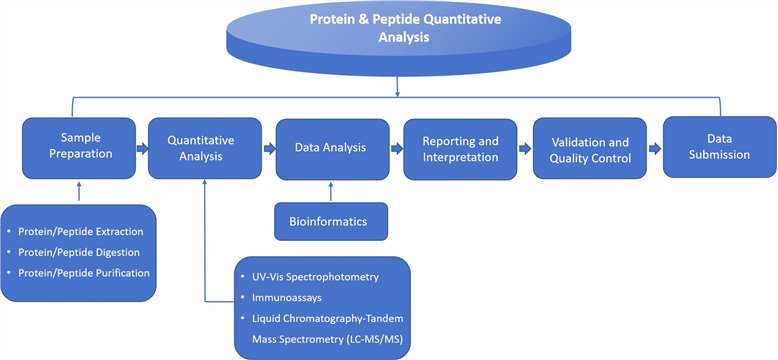 Fig. 1 Workflow of protein/peptide quantitative analysis. (CD Formulation)
 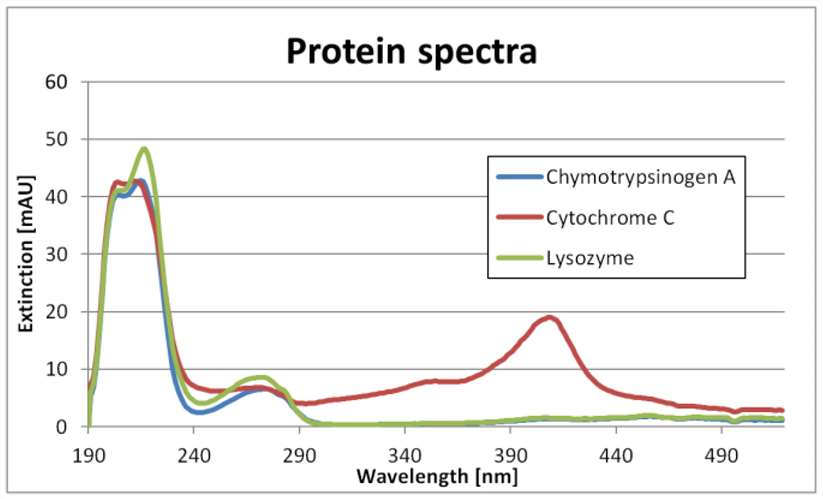 Fig. 2 Single-component spectra of Chymotrypsinogene A, Cytochrome C and Lysozyme. (Zobel-Roos S, et al., 2017)